
Using Measure Studio in Claude Data, Sheets and Whiteboards
We connected Measure Studio to Claude and had Claude build a Claude Data dashboard, a Claude Sheets spreadsheet, and a timeline in Claude Whiteboards for an account we track.
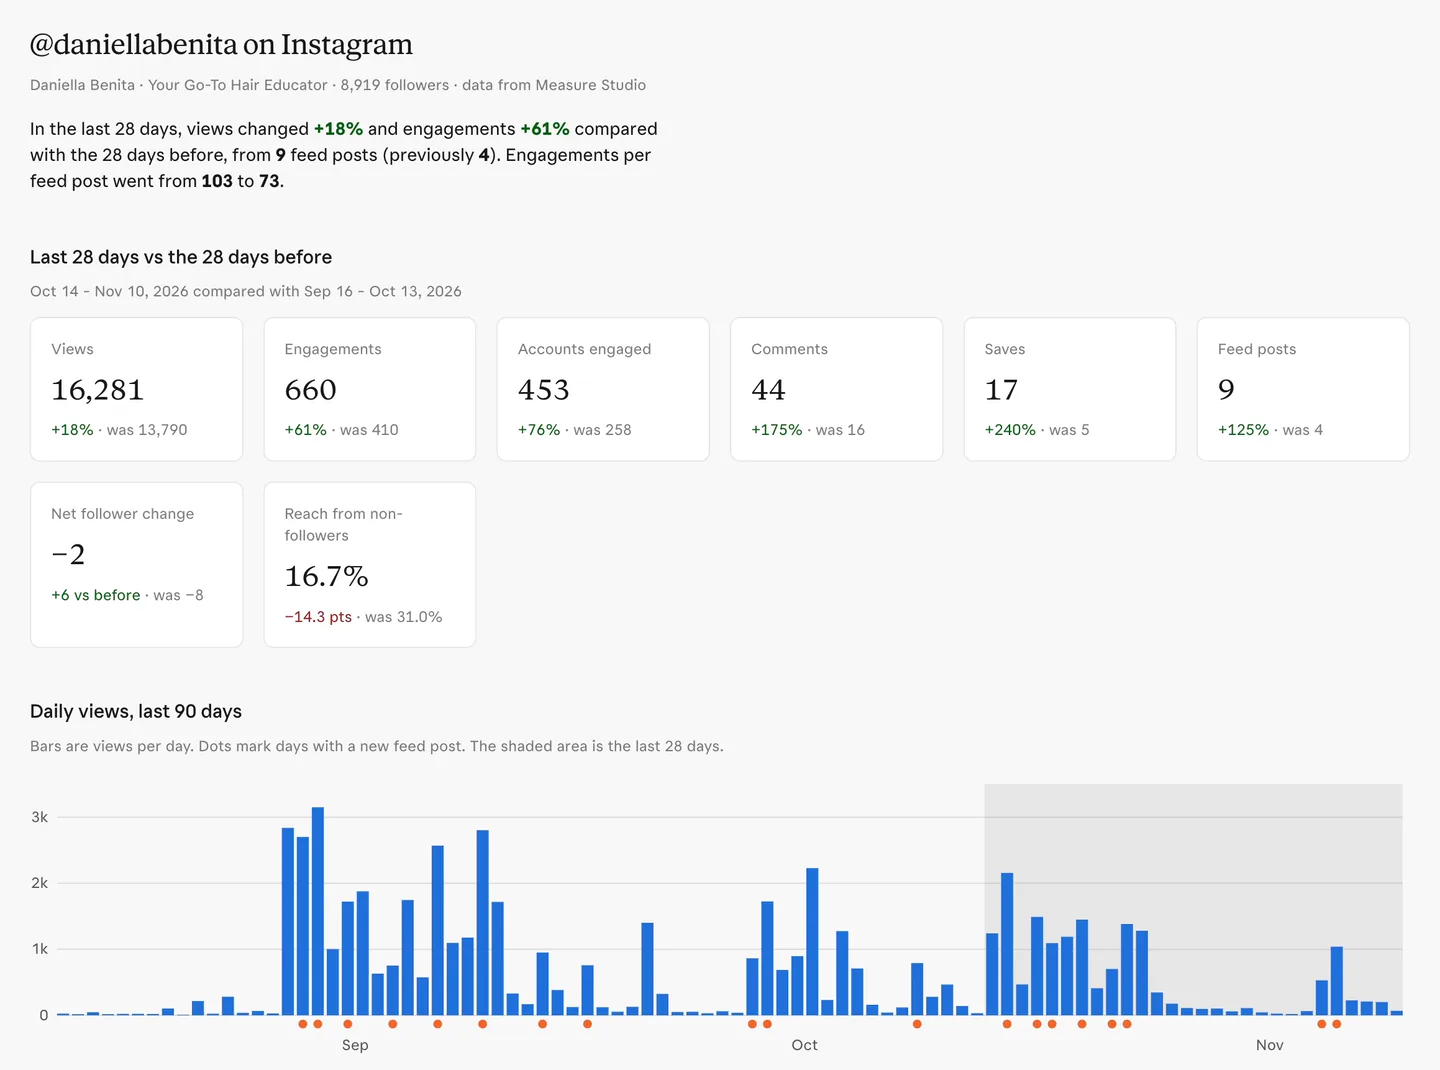
On November 10, Anthropic launched Claude Whiteboards and Sheets in beta, and Claude Dashboards became generally available as Claude Data.
Claude Data “needs a data connector, such as a warehouse or CRM.” We connected Measure Studio, which covers Instagram, TikTok, YouTube, Facebook, X, LinkedIn, Snapchat and Threads, plus Meta Ads, Google Ads and TikTok Ads.
Content Lens classifies every post on 40+ dimensions (format, talent, products, hooks, sponsors). Claude only sees the accounts, posts, reports and dashboards the Measure Studio workspace has access to.
Connecting
Measure Studio is listed in Claude’s connector directory. Search for it, click Connect to Claude, and sign in with your Measure Studio account.
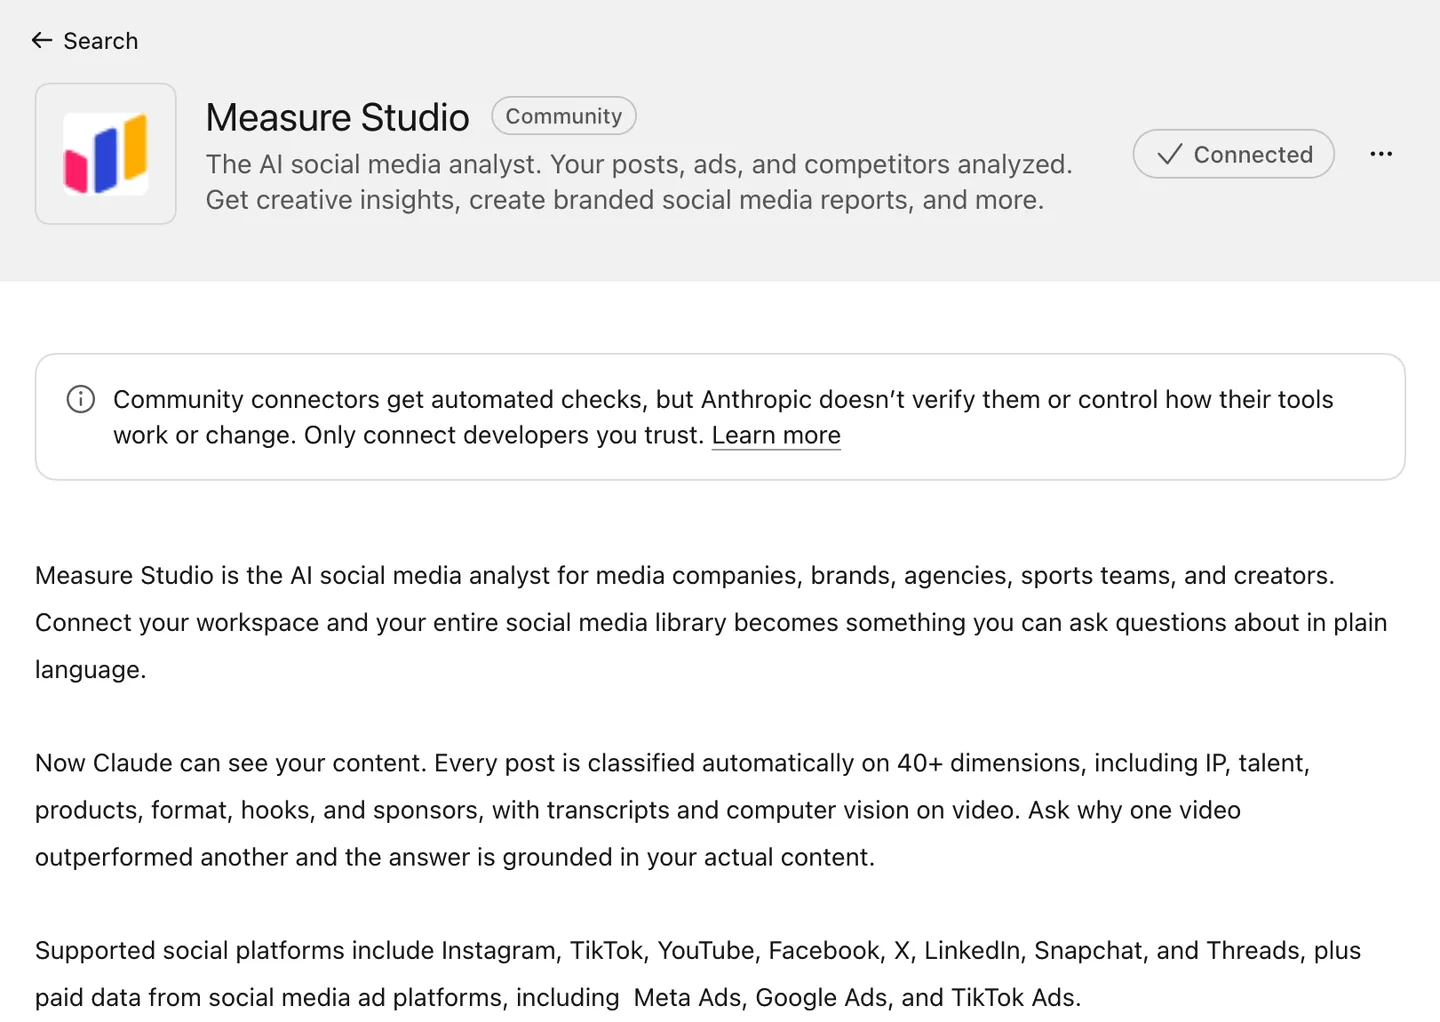
The workspace needs MCP access turned on. If you don’t have a workspace yet, start a 14-day trial, connect your profiles, and use the MCP guide for the setup.
One account
We pointed Claude at a creator account we track. The prompt was “Analyze Daniella Benita IG account using measure studio”.

Claude’s status line read “Using Measure Studio: Get account stats”.
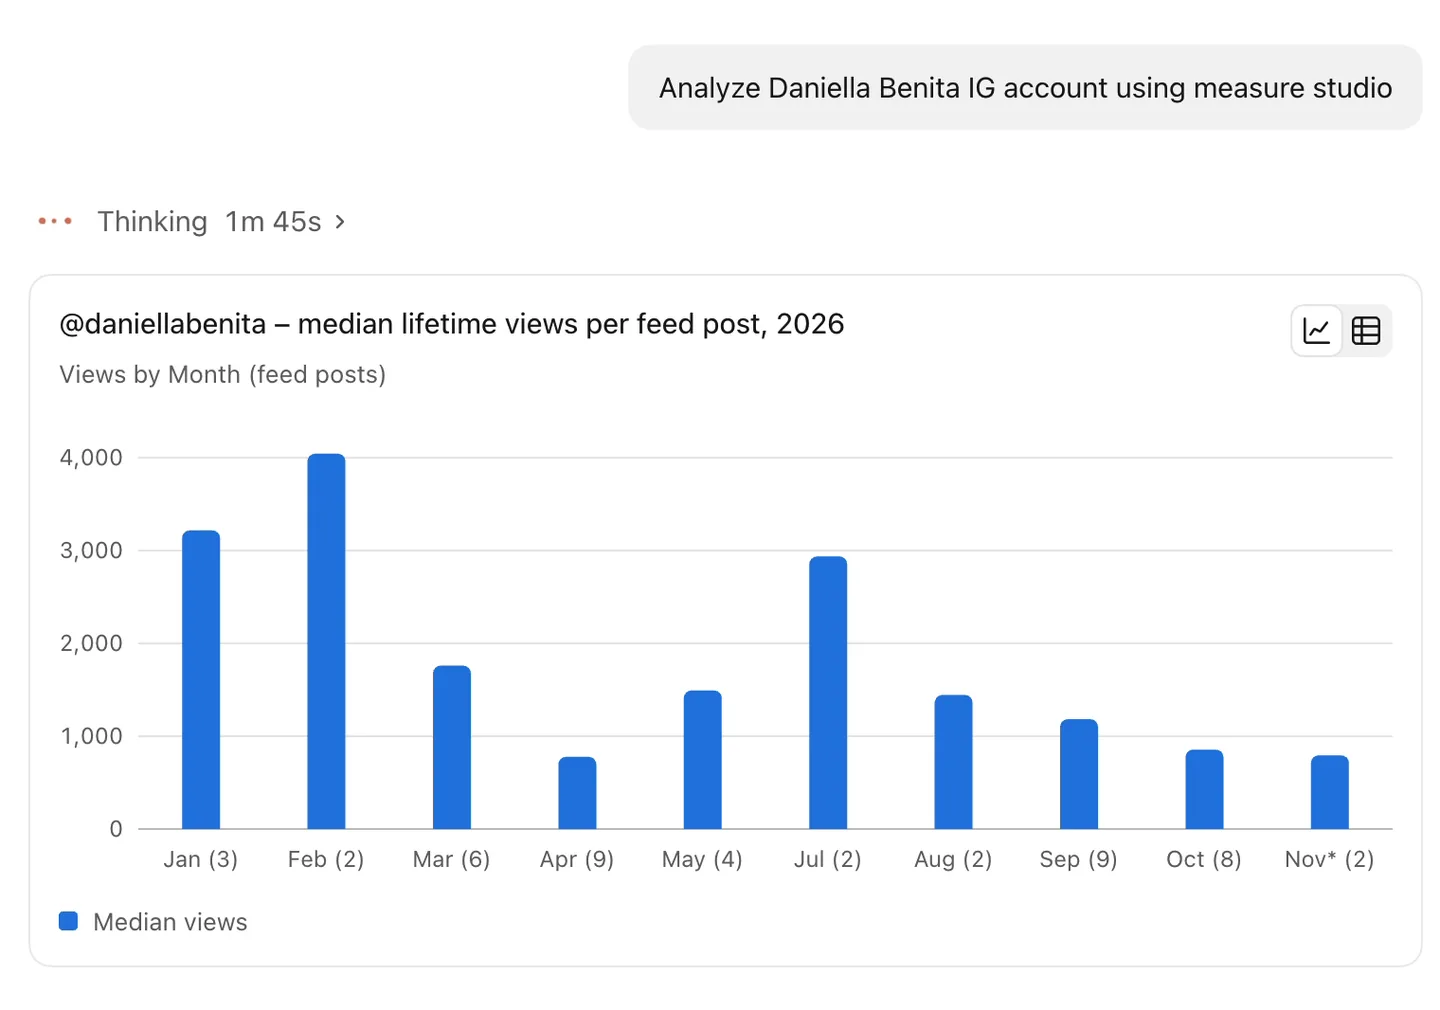
The chart shows median lifetime views per feed post, month by month through 2026.
The dashboard
We asked Claude to turn the analysis into a Claude Data dashboard. The first time it runs, Claude shows a dialog titled “This artifact uses connectors”, and you hit Continue.
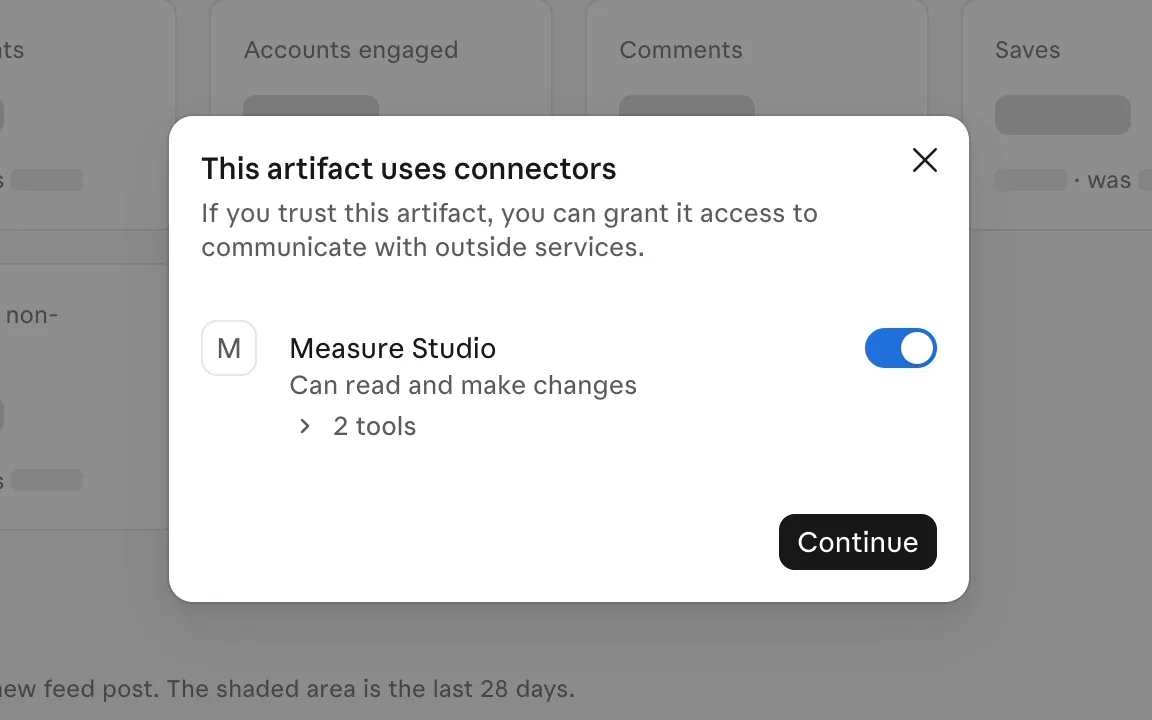
The dialog mentions making changes because Measure Studio’s tools can tag posts, create post groups and build report slides inside the workspace. They never publish, edit or delete anything on your social media accounts.
That’s the dashboard at the top of this post: a summary sentence, the last 28 days against the 28 days before, and daily views for the last 90 days with each new post marked.
You can set how often each dashboard refreshes. The numbers come from Measure Studio through the connector, so it doesn’t go stale like a screenshot or a pasted table.
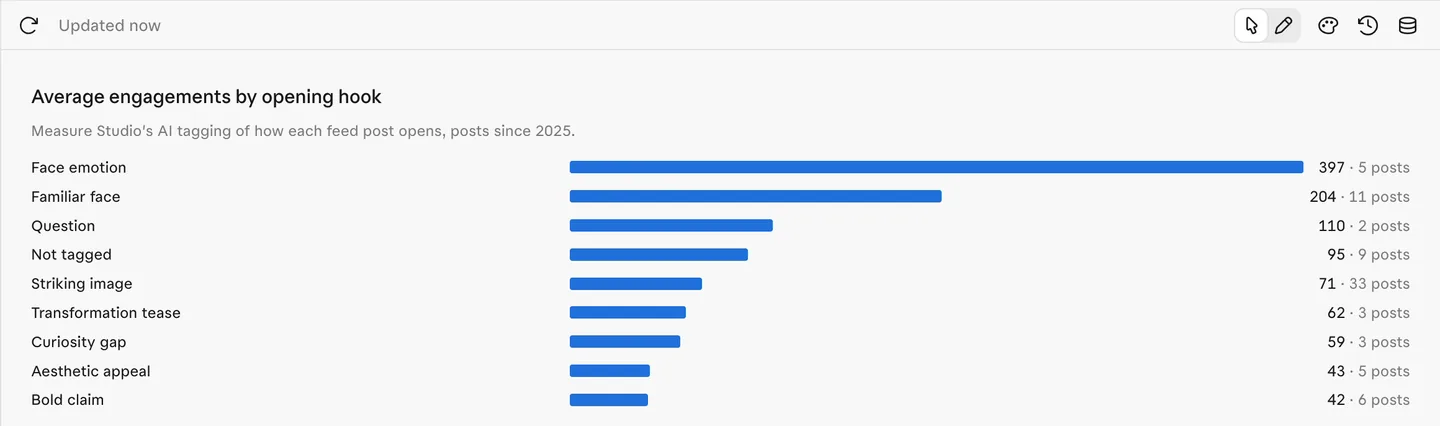
Lower on the same dashboard, Claude charted average engagements by opening hook. Content Lens had already tagged how each post opens, so Claude could rank the hooks by engagement without anyone tagging posts by hand.
The spreadsheet
We wanted the rows, so we said “Create a spreadsheet from your last answer.”
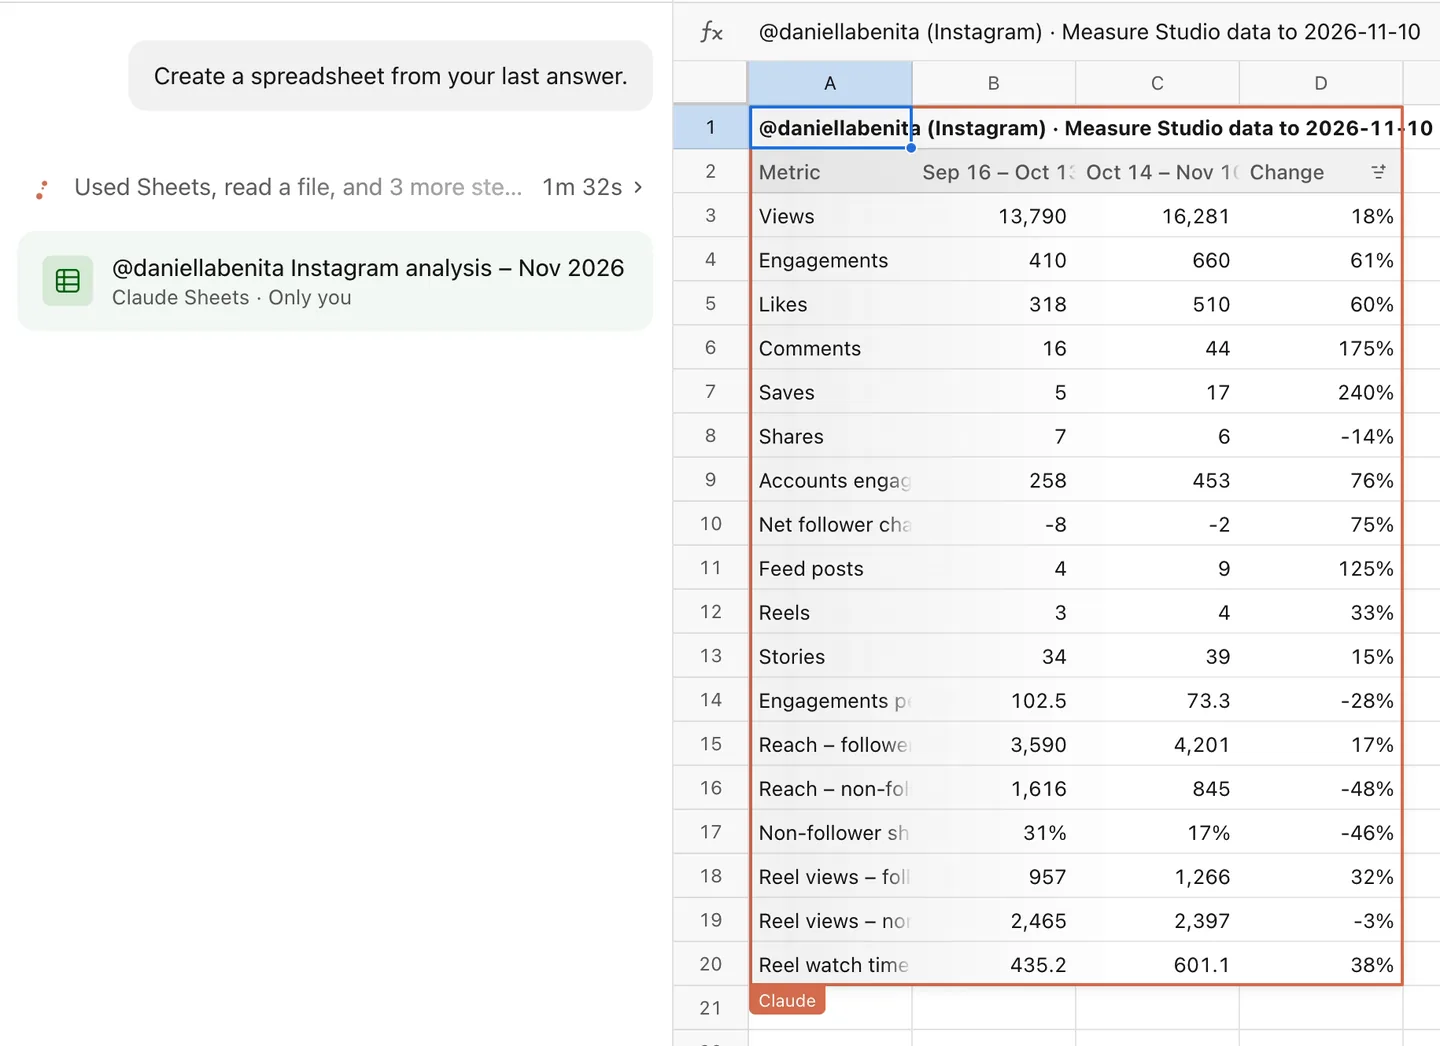
Claude Sheets can generate spreadsheets “with tabs, formulas, formatting, and drop-downs.” This one split the analysis into a 28-day comparison, findings, the monthly trend, content themes, formats and collaborations, hooks, and a list of 2026 posts. Claude outlines its edits, and you can share the sheet or export it to .xlsx or CSV.
The last 14 days
Claude Whiteboards is a shared board where your team brainstorms with Claude. Claude can turn the board into a doc or a deck.
We typed “use a whiteboard to draw timeline of posts published in last 14 days, include thumbnails.”
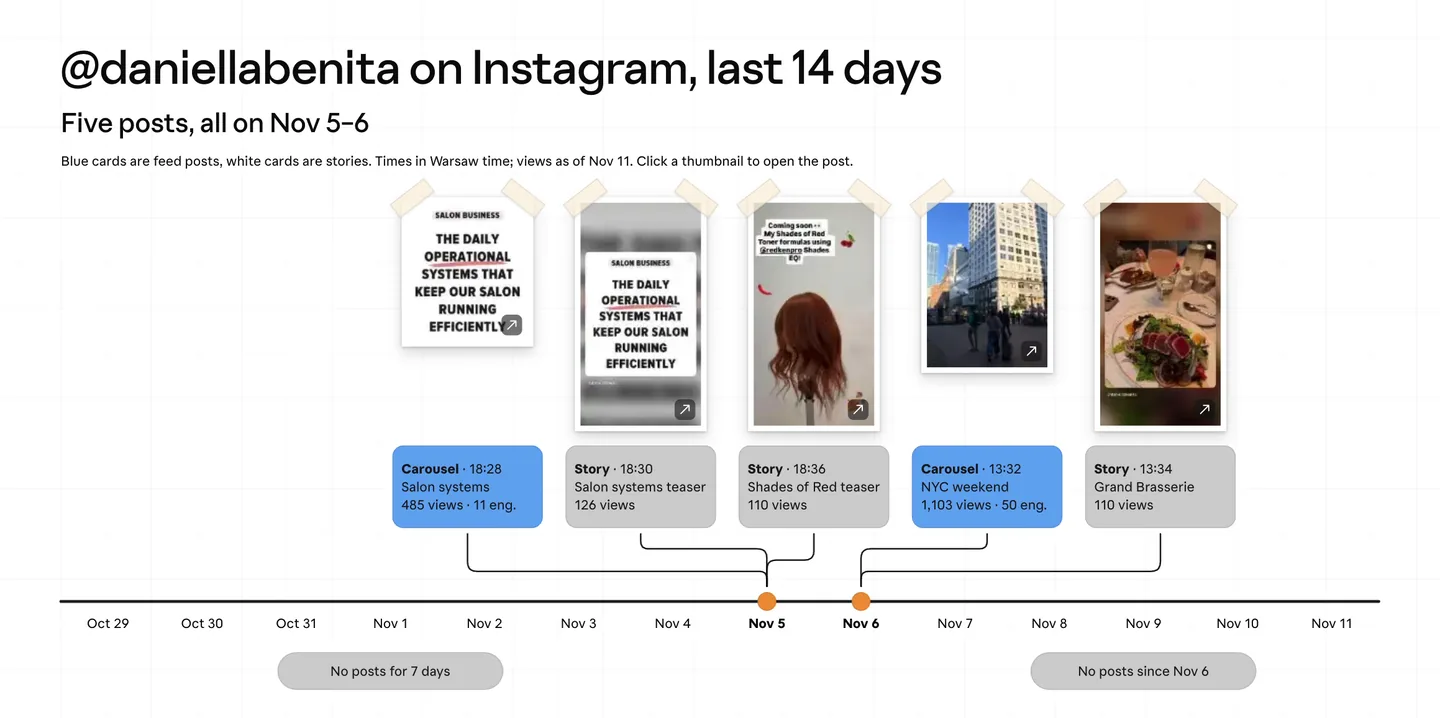
Every post sat on a dated timeline with its real thumbnail, its type, the publishing time, and its views and engagements. Days with nothing published were marked. Clicking a thumbnail opens the post.
Try it on your own accounts
Claude Data, Claude Sheets and Claude Whiteboards are available on all paid Claude plans. On Enterprise plans, an admin may need to turn them on.
On the Measure Studio side, a workspace admin turns on MCP access once in settings. Connect your social profiles, add Measure Studio from Claude’s connector directory, and try the prompts above on an account you track. Content Lens comes with every plan, and the 14-day trial needs no credit card.
Set up Measure Studio for Claude: the guide covers turning on MCP access, adding the connector and signing in.