What Social Media Metrics You Should Track & Why in 2026
Which social media metrics matter most in 2026? Track these to prove ROI and show business impact.
Social media metrics are changing faster than most teams can keep up. Take Instagram for example, where Adam Mosseri recently confirmed that views will be the new primary metric across all content types, replacing likes as the top signal of engagement.
Old tracking sheets that many marketers still rely on won’t capture this shift, and some of the metrics we have used for years are already on their way out. To make it worse, most reporting tools won’t bother supporting metrics once they’re deprecated.
That’s why now is the time to rethink your tracker, one that keeps the new numbers front and center while still holding onto the few old ones that matter for long-term growth.
In 2026, surface-level metrics such as likes and impressions won’t be enough to measure social media success. Brands will prefer metrics that demonstrate real impact, such as engagement quality, audience trust, and conversion.
So, in this blog, we will look beyond trends to discover the actionable, revenue-generating metrics that will define social media measurement in 2026.
Not only that, but we will also mention social media metrics that were deprecated this year (2025).
What organic social media metrics to watch and how to use them
Organic social media metrics measure how audiences naturally engage with your posts without any paid boosts behind it. For a long time, likes and impressions were treated as the north star, but platforms are moving away from them because they don’t prove real impact.
In 2026 the spotlight is shifting to metrics like saves, private shares, and meaningful comments. These actions signal stronger intent. People don’t just enjoy your content in the moment but they want to revisit it, recommend it, or join the conversation. That’s the kind of engagement brands can actually tie back to awareness, trust, and revenue.
- Content-level ROI
Content-level ROI measures how a specific piece of content; a LinkedIn post, podcast episode, or YouTube video, drives real business outcomes like signups, demo requests, or revenue. It goes beyond likes to see what content actually moves the needle.
How to measure it:
- UTM tagging: Add unique UTM parameters to links so conversions can be traced back to the exact content.
- Engagement-to-pipeline ratios: Compare how many people engaged with a post versus how many booked a call or made a purchase.
These metrics should be tracked per piece of content weekly, and use them to double down on formats or topics that generate the most tangible results.
- Shares and Saves
Shares and saves go beyond likes and reach, they show genuine interest and engagement. Platforms like Instagram, TikTok, and LinkedIn already give these signals more weight in their algorithms.
How to track:
Monitor your share-to-reach ratio over time to see which content formats drive the most meaningful engagement.
Use Measure Studio to quickly sort posts with the highest saves and shares, then replicate those formats. Review this weekly or monthly to spot trends and optimize content that has staying power.
- Community Growth Range
Community growth measures how your audience of advocates and active participants expands over time, and not just raw follower counts. Referrals and word-of-mouth from engaged members often have far more impact than brand messaging alone.
How to track:
Monitor growth of commenters, repeat contributors, and loyal supporters who engage consistently.
Segment by platform or content type to see where your most active communities live. Check this metric monthly to identify which community initiatives are working and double down on strategies that turn casual followers into active advocates.
- Audience Retention Rate
Audience retention measures how long people stay engaged with your content, from watch time on videos to scroll depth on posts. Completion signals, like finishing a Reel or reading a post to the end, are more meaningful than raw reach.
How to track:
Use platform analytics or tools like Measure Studio to monitor average watch time, scroll depth, or completion rate per content piece.
Compare retention across formats (videos, carousels, posts) to identify what keeps your audience engaged the longest. This is to be tracked weekly or per campaign to spot trends and tweak content formats that lose viewers too early.
- Dark Social Attribution
Dark social attribution tracks private sharing, the WhatsApp messages, Slack posts, emails, or texts where your content gets passed directly to someone.
These shares often indicate stronger interest than a casual like or comment and can bring in highly qualified leads.
How to track:
Use UTM-tagged or shortened links to see when shared content generates clicks. Add ‘Share via Slack/Email’ buttons to blog posts and newsletters.
Monitor GA4 Direct traffic spikes after publishing, a useful proxy for dark social activity. Review weekly or monthly to see which content resonates deeply enough to be shared privately, then prioritize similar formats.”
- Customer Journey Completion Rate
Customer Journey Completion Rate measures how many users successfully move through your funnel stages, from awareness, to consideration, to conversion.
A low rate highlights friction points like content gaps, poor nurture, or misaligned targeting, while a high rate shows your funnel is performing well.
How to track:
Use GA4 or your CRM to monitor how many users advance from one stage to the next. Pay attention to drop-offs between stages to identify where people churn and optimize accordingly.
This is best tracked weekly or per campaign to spot friction quickly and adjust content, targeting, or nurturing strategies.
Read: How to Check Your Goal Progress with Targets in Measure Studio
What paid social media metrics to watch in 2026 and how to use them
Paid social media metrics go beyond vanity numbers, they show whether the money you’re putting into ads is actually moving the needle.
It’s not just about impressions or clicks, it’s about proving ROI and making sure every dollar spent works harder.
CPC, CTR, conversion rates, and ROAS reveal what’s really driving results. Tracking these consistently makes it easier to spot wasted spend and double down on campaigns that deliver.
- Customer Acquisition Cost (CAC)
Customer Acquisition Cost (CAC) is the total cost to acquire a new customer, including ad spend, creative, even team costs. With rising ad prices and strict privacy rules limiting cheap targeting, CAC keeps your campaigns grounded in real efficiency.
How to track:
Include all relevant costs: ads, creative, and team time. Pair CAC with Customer Lifetime Value (LTV) to assess ROI, a $200 CAC is healthy if LTV is $1,500. Monitor by campaign, audience, or channel to see where acquisition is most cost-effective.
Track weekly or per campaign to quickly identify campaigns that are over- or under-performing and adjust budgets or targeting accordingly.
- Return on Ad Spend (ROAS)
Return on Ad Spend (ROAS) shows how much revenue you earn for every dollar spent on ads. For example, spending $1,000 and earning $4,000 equals a 4x ROAS.
How to track:
Formula: ROAS = Revenue ÷ Ad Spend
Break ROAS down by campaign, ad set, or audience to spot which elements are driving results.
Don’t just chase the number, one ad set can carry most of the weight while others quietly drain your budget. Track weekly to identify top-performing campaigns and reallocate spend to maximize ROI.
- Cost per Action (CPA)
CPA measures the average cost to achieve a specific conversion, like a demo sign-up or resource download. Unlike CPC, which only tracks traffic, CPA shows the true efficiency of your ad spend by tying it directly to outcome-driven actions.
How to track:
Formula: CPA = Total Ad Spend ÷ Number of Conversions
Monitor by campaign, ad set, or audience to identify where your ads are most cost-effective.
Compare CPA to the value of the conversion, a $50 CPA may be acceptable for a $200 sale but not for a $20 lead. Track daily for active campaigns, or weekly for broader trends, and adjust bids or targeting accordingly to improve efficiency.
4. Predictive Lifetime Value (LTV)
This predicts the total revenue a customer will generate over time, based on past behavior like purchase frequency, average spend, and retention. It helps you focus on long-term value rather than short-term profits.
How to track:
Formula (simplified): LTV = Average Purchase Value × Purchase Frequency × Customer Lifespan
Compare LTV to your CAC to see if acquisition costs are justified e.g., a $150 CAC is fine if LTV is $600, but not if LTV is only $180. Segment by customer type or acquisition channel to prioritize profitable audiences.
Review monthly to guide ad spend, optimize campaigns, and focus on acquiring customers who bring long-term value.
- View-Through Conversions (VTC)
VTC captures users who saw your ad but didn’t click, yet converted later through another channel. This helps give credit to ads that influence conversions indirectly.
How to track:
Most ad platforms, Meta Ads Manager, Google Ads, LinkedIn, let you set a view-through conversion window (e.g., 1-day, 7-day, 28-day).
Compare conversions across windows to see how much ’invisible lift’ your ads are generating. Segment by campaign or audience to understand which ads assist conversions even without direct clicks.
Review weekly or per campaign to optimize ad placements and budgets based on both direct and assisted conversions.
What about the custom metrics?
Metrics like clicks, shares or even CAC are important, but they’re not enough anymore.
Brands have different business models, different funnels, and different definitions of “success.” Custom metrics let you build scorecards that actually match your goals instead of copying generic dashboards.
1. Cross-platform engagement blends
Cross-platform engagement blends combine metrics from Instagram, LinkedIn, YouTube, and other channels into a single view. This helps identify content that performs consistently well across platforms, rather than excelling on just one.
How to track:
Aggregate engagement metrics like likes, shares, comments, and saves across all platforms. Use Measure Studio that centralizes data to spot high-performing content formats.
Compare performance by content type to see which resonates universally with your audience. Review monthly to guide content strategy and replicate formats that succeed across channels.
- Goal-specific composites
Goal-specific composites are custom scores you create based on what matters most for your brand. For example, you might weight comments and saves higher than likes to calculate a content ‘stickiness’ score.
Example scoring:
Likes = 1 point
Comments = 3 points
Saves/Shares = 5 points
Add up the points for each post to get a single number that reflects its true value according to your goals.
Review weekly or monthly to identify content that drives meaningful engagement and refine your scoring model over time.
- Business-aligned KPIs
Business-aligned KPIs tie marketing metrics directly to business outcomes. Instead of just tracking generic metrics like ‘Cost per Lead,’ focus on Cost per Qualified Lead, leads that actually make it to sales calls. This gives a more accurate view of your funnel’s health.
How to track:
Segment leads by qualification status to see which campaigns drive high-quality prospects. Compare costs and conversion rates across campaigns to prioritize the most profitable channels.
Track weekly or per campaign to ensure marketing efforts align with business goals and ROI.
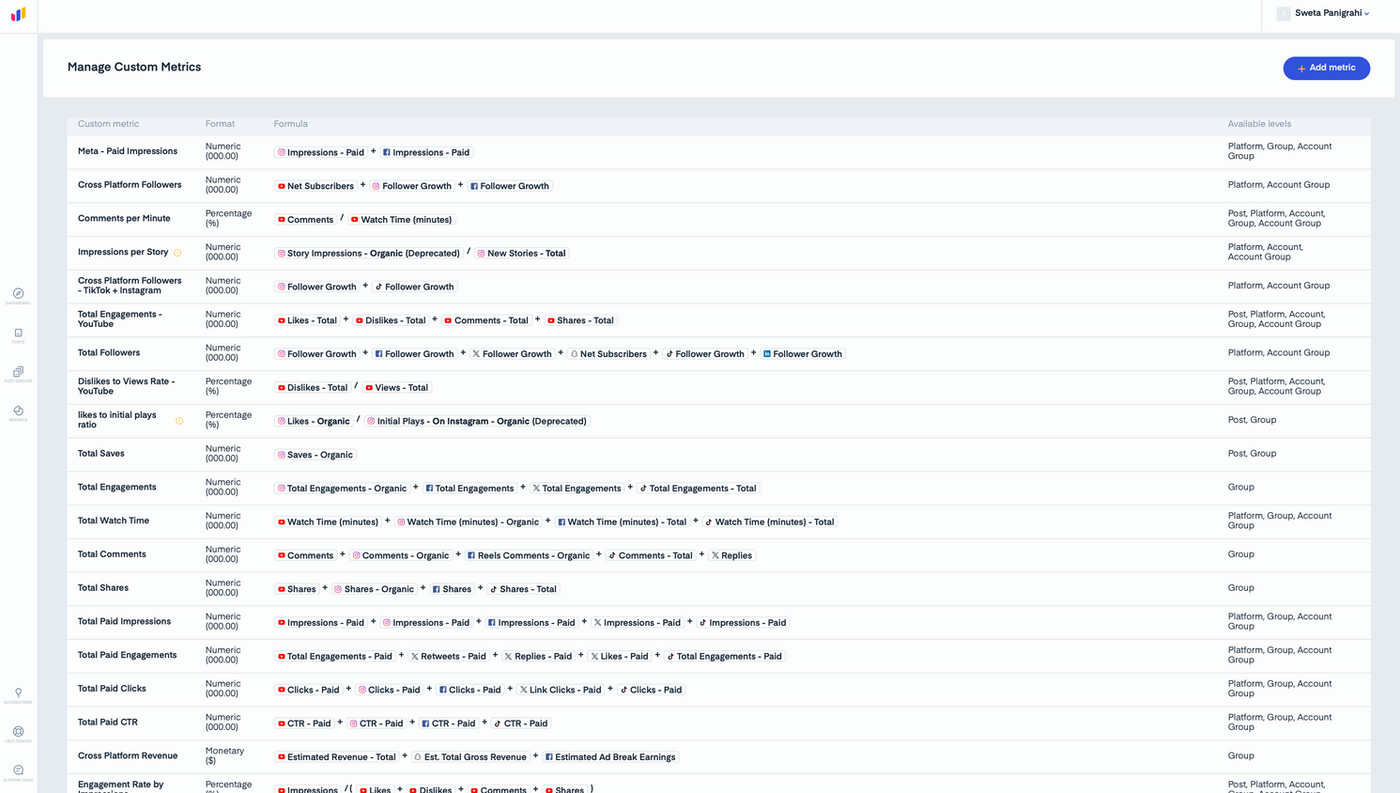
Measure Studio makes this process easier by letting you define your own KPIs, tag content, and build custom dashboards.
The benefit is you’re not stuck with vanity metrics. Rather, you’re creating a measurement system that works with your leadership team’s language.
Read: Top 10 Ad Campaign Metrics That You Should Track
How to operationalize this without drowning in spreadsheets
The problem with advanced metrics isn’t knowing what to track, it’s keeping up with the tracking itself.
Most teams end up buried in messy Google Sheets, copying and pasting numbers from each platform, hoping nothing breaks along the way.
| Problem | Traditional Approach | Modern Solution | Benefit |
|---|---|---|---|
| Buried in messy google sheets. | Copy-paste numbers from each platform manually. | Connect all social accounts (YouTube, TikTok, Instagram, Facebook, etc.) to a dashboard. | Saves time, reduces errors, ensures all data is centralized. |
| Hard to compare performance across platforms | Separate sheets for each channel | Cross-platform dashboard view | Spot trends and top-performing content instantly |
| Difficulty tracking custom metrics | Manual calculations in spreadsheets | Build custom metrics directly in the tool (e.g., saves-to-likes ratio) | Quickly see what content is truly driving impact |
| Exporting data for reporting | Manual compilation | Export clean spreadsheets or PDFs in seconds | Shareable, error-free reports without extra work |
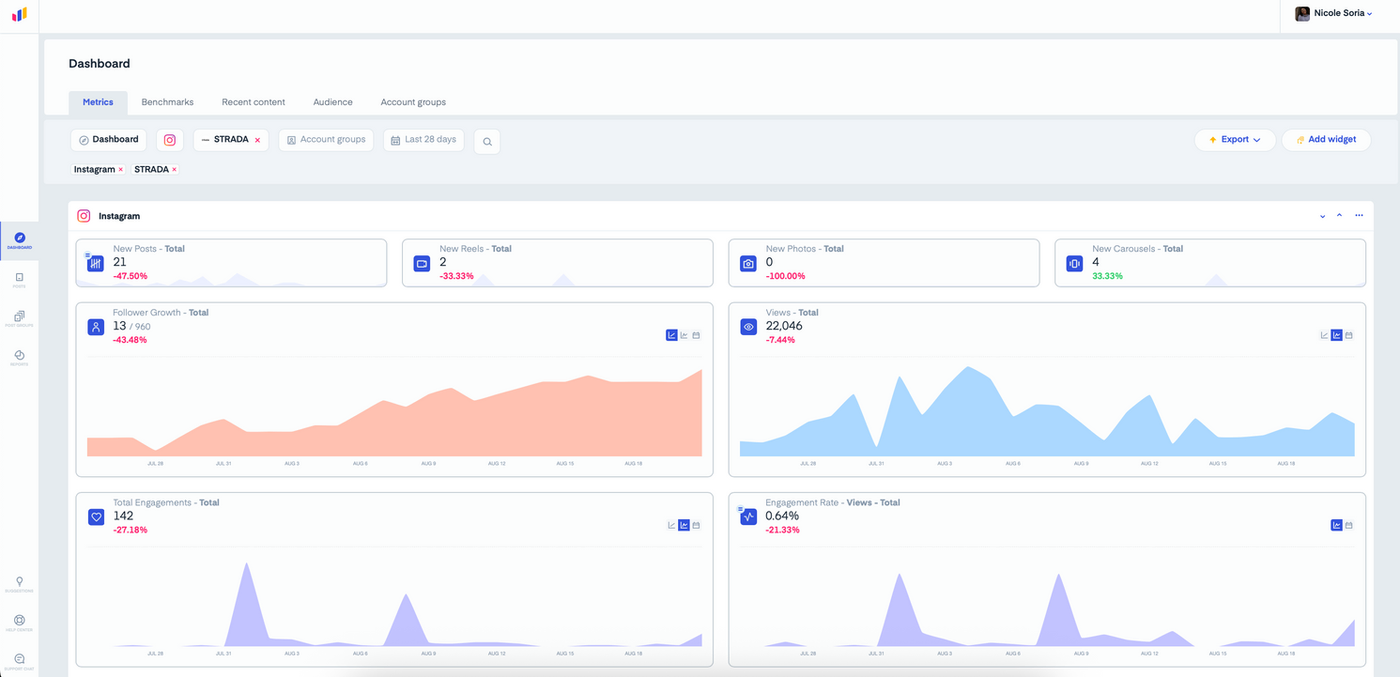
Now here is where Measure Studio changes the game. Instead of juggling endless spreadsheets:
You connect your social accounts (YouTube, TikTok, Instagram, Facebook, etc.) directly. The tool automatically pulls in all the raw data and organizes it into one clean dashboard.
You can compare performance across platforms, build custom metrics (like saves-to-likes ratios), and tie content performance back to bigger business outcomes.
And yes, if you still need a spreadsheet or PDF, you can export it in seconds, but the real win is that you no longer have to live inside spreadsheets.
Read: Top 10 Ad Campaign Metrics That You Should Track
What social media metrics you should not add to your reports
For years, marketers have obsessed over vanity metrics such as likes, reach, and impressions. But that is changing.
This year (2025) Meta has started phasing some of these metrics out. In fact, several metrics have already been deprecated on both Facebook and Instagram.
On Instagram, it’s clear that “impressions” is the main casualty. Between March and April 2025, Instagram began consolidating impression-based metrics into the new Views metric. That means many of the numbers we once tracked have now officially ended.
Here are a few examples (all deprecated by 2025):
- Media Impressions
- Story Impressions
- Carousel Album Impressions
- Reel Plays & Reel Replays
- Profile Impressions
While on Facebook, Meta announced that starting November 15, 2025, the metrics “impressions” and “page_fans” will be deprecated for the Page Insights API.
After that date, calling those metrics via the API will return an “invalid metric error”.
Read: What Does Meta’s Shift to Views From Impressions Mean for Your Social Media Strategy?
Wrapping up
In 2025, the landscape of social media marketing is evolving. It’s no longer sufficient to rely solely on follower counts or surface-level impressions.
The focus has shifted towards understanding the true impact of your content. The most successful teams are those that:
- Monitor ROI: Assessing the return on investment to ensure resources are being utilized effectively.
- Recognize Dark Social Influence: Acknowledging the subtle yet significant impact of private sharing on platforms like WhatsApp and Slack.
- Analyze Customer Journey Progression: Understanding how users move through the awareness, consideration, and conversion stages.
- Prioritize Intent-Driven Engagement: Focusing on interactions that indicate genuine interest, rather than just vanity metrics.
The distinction between high-performing teams and others lies not in the volume of reports generated but in how effectively they connect their metrics to tangible business outcomes.
This is where Measure Studio becomes invaluable. It transcends generic analytics by enabling you to:
- Integrate organic and paid metrics to seamlessly track and compare performance across both organic and paid social media efforts.
- Create custom metrics to tailor metrics to align with specific business goals and objectives.
- Generate comprehensive reports that provide actionable insights, facilitating informed decision-making.
By leveraging such tools, you can transition from traditional methods to a more streamlined and insightful approach, ensuring that your social media strategy is both effective and aligned with your business objectives.
Get started with Measure Studio today.
Author Bio

Sofiyah Abdullateef is a SaaS content marketer and SEO writer who helps growing B2B brands turn complex tools into stories that win attention (and customers). Check out her LinkedIn to see what she is up to.
Frequently Asked Questions
Why should we stop tracking followers or impressions?
Because they don’t tell you anything about actual business impact. You can have 10K followers and still not drive a single lead. Quality engagement and ROI-driven metrics beat vanity numbers every time.
What is “dark social” and why does it matter?
Dark social refers to shares that happen in private channels (WhatsApp, Slack, email). These don’t show up in traditional analytics but often drive high-intent traffic. Ignoring them means you’re missing a big chunk of the real picture.
Do I need an expensive tool to measure all this?
Not necessarily. You can start with Google Analytics, and UTM tagging to track traffic sources. But as you scale, tools like Measure Studio save time by centralizing your performance data across all platforms and cutting out manual errors.
What’s one metric to prioritize if I can’t track all of them?
Content-level ROI. If you can show how your content ties directly to leads or revenue, you will always have leadership buy-in. Everything else builds on top of that.